Seagrass density scoring vs. percent cover: what's the difference?
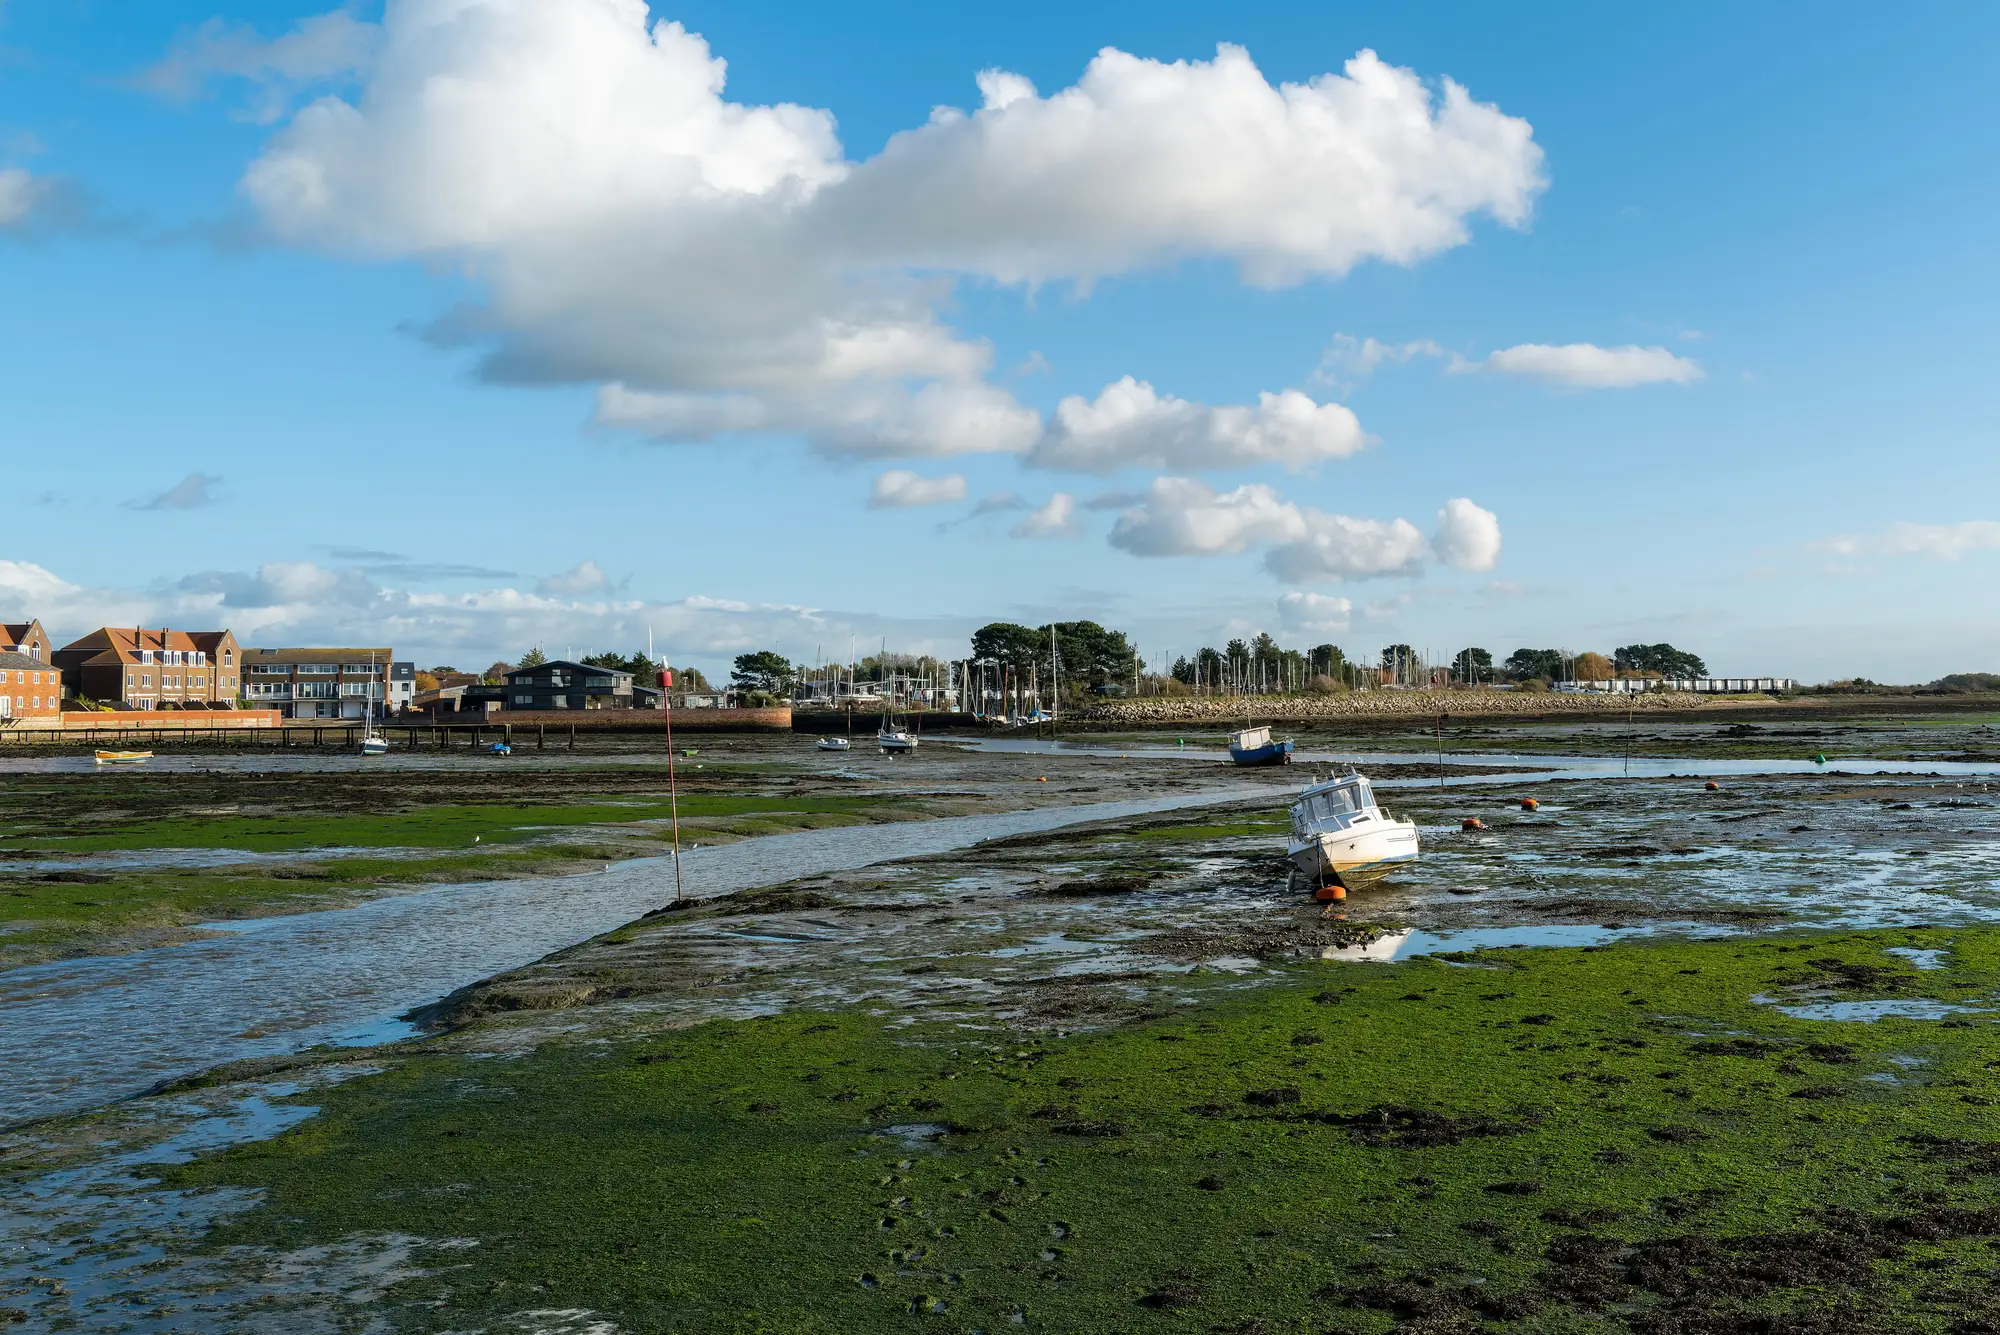
Field crews running a seagrass transect learn quickly that the two numbers on every data sheet aren't the same thing, even though they get used interchangeably in meetings. Percent cover tells you how much of your quadrat has seagrass in it at all. Density tells you how thick that seagrass is where it exists. A meadow can score 80% cover and still be thin and patchy inside each shoot cluster, or score 40% cover with the shoots packed tight in the patches that are there. Mixing the two up is how a baseline report ends up overstating meadow health, or underselling a site that's doing fine.
Percent cover and cover classes
Percent cover is the simplest metric in the seagrass monitoring toolkit: lay down a quadrat, estimate what fraction of the bottom inside it is covered by seagrass blades versus bare substrate or other vegetation, and record the number. Most field programs don't record a precise percentage. They bin it into cover classes, commonly following something close to the Braun-Blanquet scale: trace, 1-5%, 6-25%, 26-50%, 51-75%, 76-100%. Cover classes exist because eyeballing "38% versus 42%" underwater with limited visibility is a fool's errand, but "this quadrat is clearly in the 26-50% band" is something two divers can agree on.
Cover classes are fast to collect and they're what most long-running monitoring programs report against year over year, which makes them useful for trend comparison. Their weakness is that cover alone can't distinguish a meadow that's spreading edge-first from one that's thickening in place. Two surveys five years apart can show the same cover class and still represent very different trajectories for carbon storage or fish habitat, because cover doesn't say anything about shoot density within the covered area.
Where density scoring comes in
Density scoring (sometimes shoot density, sometimes just "relative density") measures how packed the seagrass is in the spots where it's present, usually as shoots per square meter from a quadrat count, or as a relative scale (sparse, moderate, dense) when counting every shoot isn't practical. Density is the metric that correlates more directly with blue-carbon biomass and with structural habitat value for juvenile fish and invertebrates. A blue-carbon baseline that only logs percent cover is missing half the picture: two meadows with identical footprints can hold very different amounts of carbon depending on how dense the canopy is inside that footprint.
The catch with density is that it's slower to collect in the field. Counting shoots in a quadrat takes real bottom time, and scaling that up across a whole bay means either a lot of dive hours or a sampling design that extrapolates from a handful of plots to the rest of the meadow. That's the gap between "what we know at our sample points" and "what's true across the estuary," and it's the gap that tends to widen as a monitoring program's footprint grows faster than its dive budget.
Why both numbers belong in a baseline
A habitat baseline that reports cover without density, or density without a sense of extent, is only answering half the question a program manager actually has. The useful version pairs the two: where is the meadow (extent, usually from cover-class mapping or classified imagery), and how thick is it within that footprint (relative density, from field sampling or a density-correlated spectral signal). Reporting them separately, rather than folding them into a single ambiguous "health score," keeps the baseline honest about what each number can and can't tell you, and makes it easier to track whether a decline shows up as the meadow shrinking at the edges or thinning in the middle.
An annual remote-sensing pass is built to answer that question at scale, across water no dive team could fully cover in a season. Seagrass Mapping turns a yearly multispectral satellite pass into a map of meadow extent and relative density across a bay or estuary, giving you a layer to sit alongside your ground-truth quadrats. It's an early-access workflow we're building out with agencies piloting it on one site first, so if your baseline needs that extent-and-density picture, it's worth a look.